Projects
Using Pennsylvania Census Data to Profile Potential Mortgage Consumers
Completed as final project during Certificate of Data Science at UC Irvine
Objective
For people, housing is essential to living, as without shelter, it is extremely difficult to lead a normal life. Being able to afford a home may rest in whether a family decides to purchase a home or by taking on a mortgage to pay off the price of the property over time. For mortgage companies, it is important to identify who potential customers are and what characteristics make up an average mortgage holder. In this project, we aim to create a model to predict whether a customer for an imaginary Mortgage Company "MortgCo" is likely to have a mortgage for their home based on independent factors.
The Data
The data used is a subset of US Census data between 2012 and 2016. The census data is taken specifically for the state of Pennsylvania.
| Feature and Description | Reasoning for Selection |
|---|---|
| NP: Number of Persons associated with this housing record | The larger the family unit, the more resources must be split, lower income per capita for the household. |
| FES: Family Type and Employment Status | Family units type (single vs married) and employment status can factor into the ability to afford full price of property. |
| HHT: Household Type | Household type can determine whether or not a person is in the stage to fully own a property or owning via mortgage or loan. |
| HINCP: Household Income (Binned by frequency, 7 bins) | Household income largely determines whether or not a household can afford the cost of fully owning a home or whether they will likely opt for a mortgage or loan. |
| MV: When moved into house | As time progresses, the larger chance that the homeowner will have either completely paid off property or owns the property. |
| TEN: Tenure, owned with mortgage vs owned free and without loans | This is the variable measured. The Tenure is categorized into two subsets, 1: Households that own their house with a mortgage or loan. 2: Households that own their homes free and clear. |
How can we identify potential candidates for our mortgages by profiling potential or non-potential customers?
Constructing the Model: Selecting model to approach how to classify profiles
In order to approach the business problem, we selected the decision tree model as it will be able to make informed judgments based on the most important criteria. We selected this model over a logistic regression because we are able to more accurately fit a profile based on how each variable interacts with each other. For example, a family unit with a larger number of family members may still opt for a mortgage despite having a larger Household Income, whereas a family with 1 family member who may have a lower Household Income, may own property. Because there are many variables that make up how a person can be profiled, it is important to select a model that can sort data into groups of likeness.

Naive Solution: Classification using only Household Income
A usual method for determining whether a family has a mortgage is by examining their houshold income. By using a random forest classifier, we get the following confusion matrix:

| Mortgage | Actual True | Actual False |
| Predicted True | 21217 | 11787 |
| Predicted False | 9160 | 15409 |
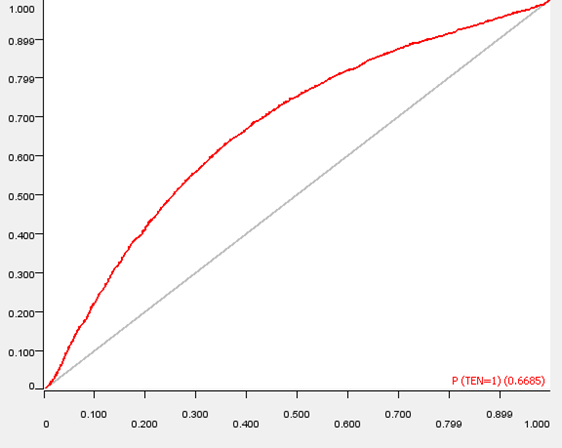
We can see from the confusion matrix that we lean towards predicting that a household does have a mortgage. This leads us to predict false positives fairly often. Observe to the right, where we plot the ROC curve for this classifier. The area under the curve for this ROC curve is approximately 0.67.
Classification using Multiple Features

| Mortgage | Actual True | Actual False |
| Predicted True | 12743 | 4744 |
| Predicted False | 3079 | 7448 |
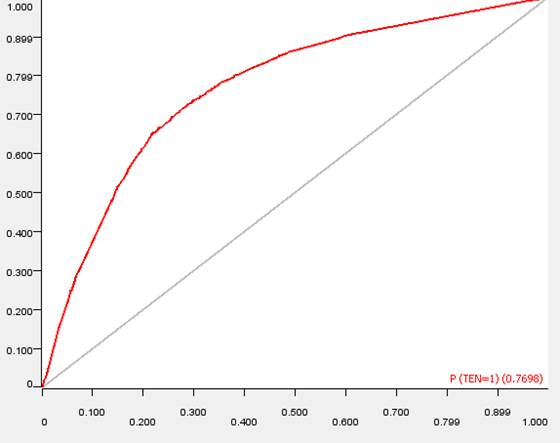
We can see from our new confusion matrix that we predict far less false negatives with our selected features. To the right, we can see that the ROC Curve is now much further away from the 1:1 line.
How CRISP-DM is applied to this business problem?
The business problem is introduced, and we apply our understanding of what factors may be important to profiling potential customers of MortgCo. We can use this extract critical variables to include into our model. We prepared the data by assigning different variable types (integer vs string) to each variable based upon how the variable was stored, and represented a large range of values (Household income) by sorting each value as being part of a subset or “bin”. The model was selected by evaluating what model would be valuable based on the spread of the data and what would give us the best answer to our customer profile. A decision tree model including 5 key variables was trained on 80% of a dataset and evaluated on the remained 20% of the dataset to check accuracy of the model. Deployment remains based on decisions that MortgCo Executives may make based on our predictions and findings.
Accuracy Statistics for Model
Accuracy: 72.075%
Error: 27.935%
Correct Classified: 20,191
Incorrectly Classified: 7,823
Cohen kappa (k): 0.423
Dataset: Pennsylvania Housing Census 2012-2016
Training Data / Evaluation: 80% / 20%
Conclusion
We created a model based on 5 key variables that are available from Pennsylvania Census Data:
- NP: Number of Persons associated with this housing record
- FES: Family Type and Employment Status
- HHT: Household Type
- HINCP: Household Income (Binned by frequency, 7 bins)
- MV: When moved into house
- TEN: Tenure, owned with mortgage vs owned free and without loans